

Sea surface temperature
SST charts by region
Daily satellite sea surface temperature for every region we cover, rendered at 1km with isotherm contour lines and clipped tight to the coastline. Pick your water.
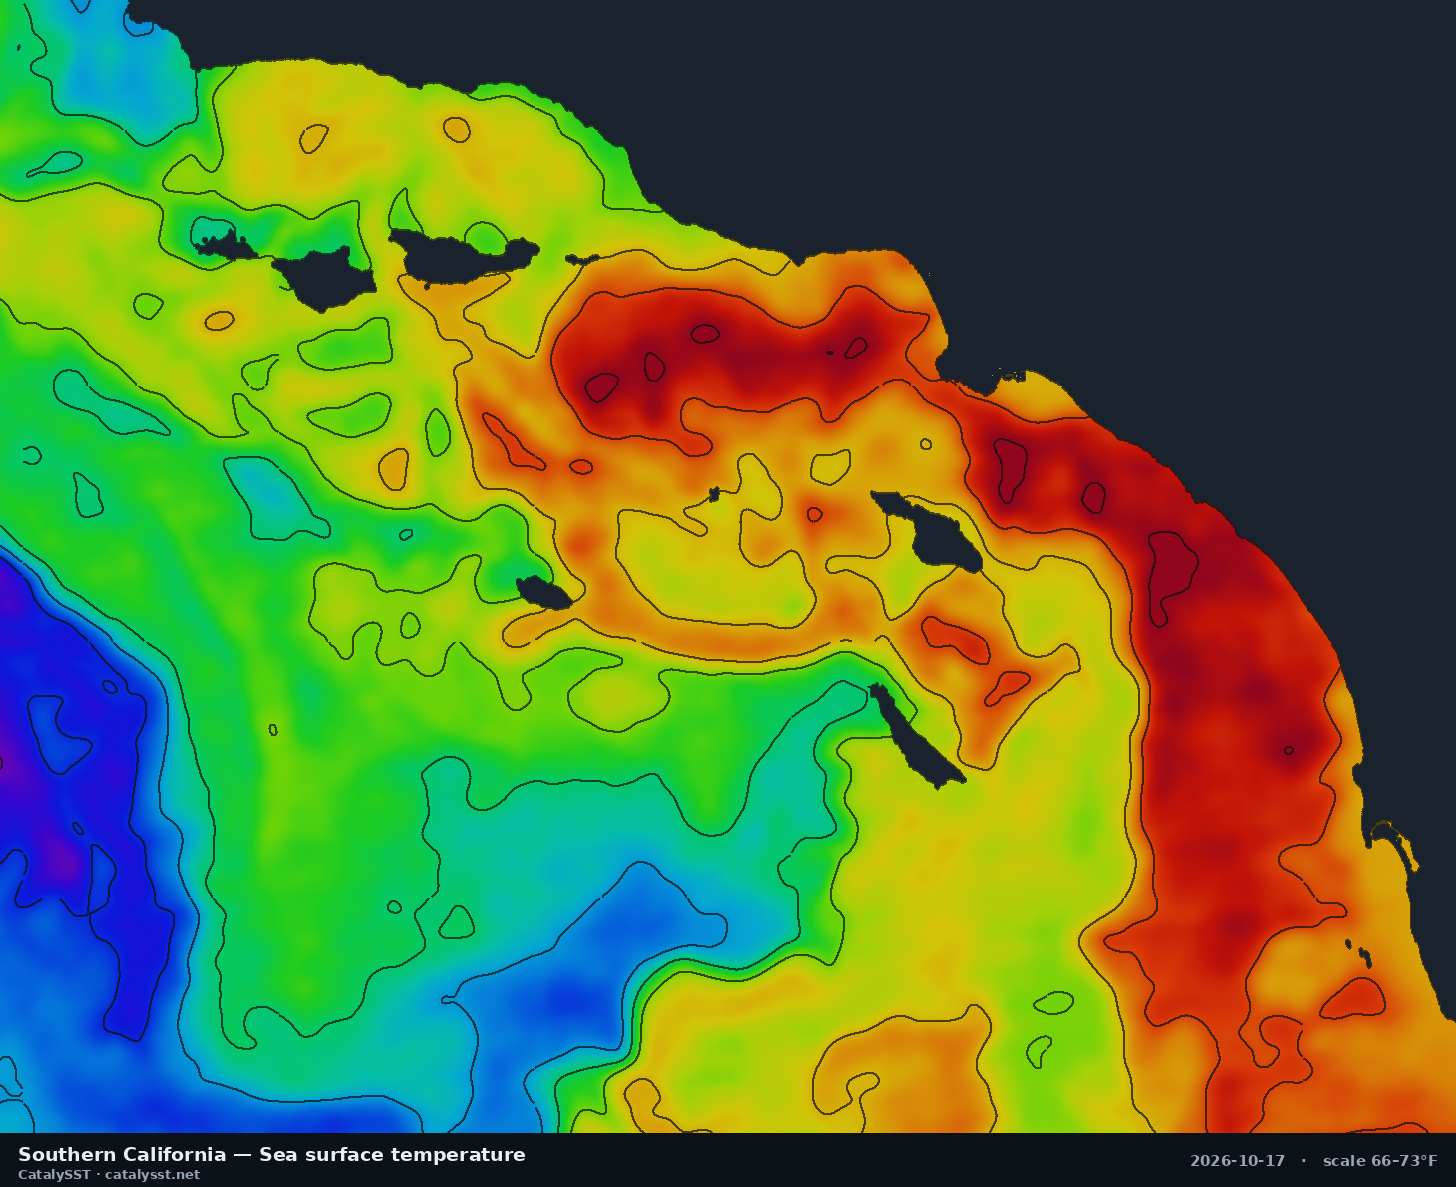
Southern California
Satellite data from October 16, 2026
San Diego · Catalina · San Clemente Island
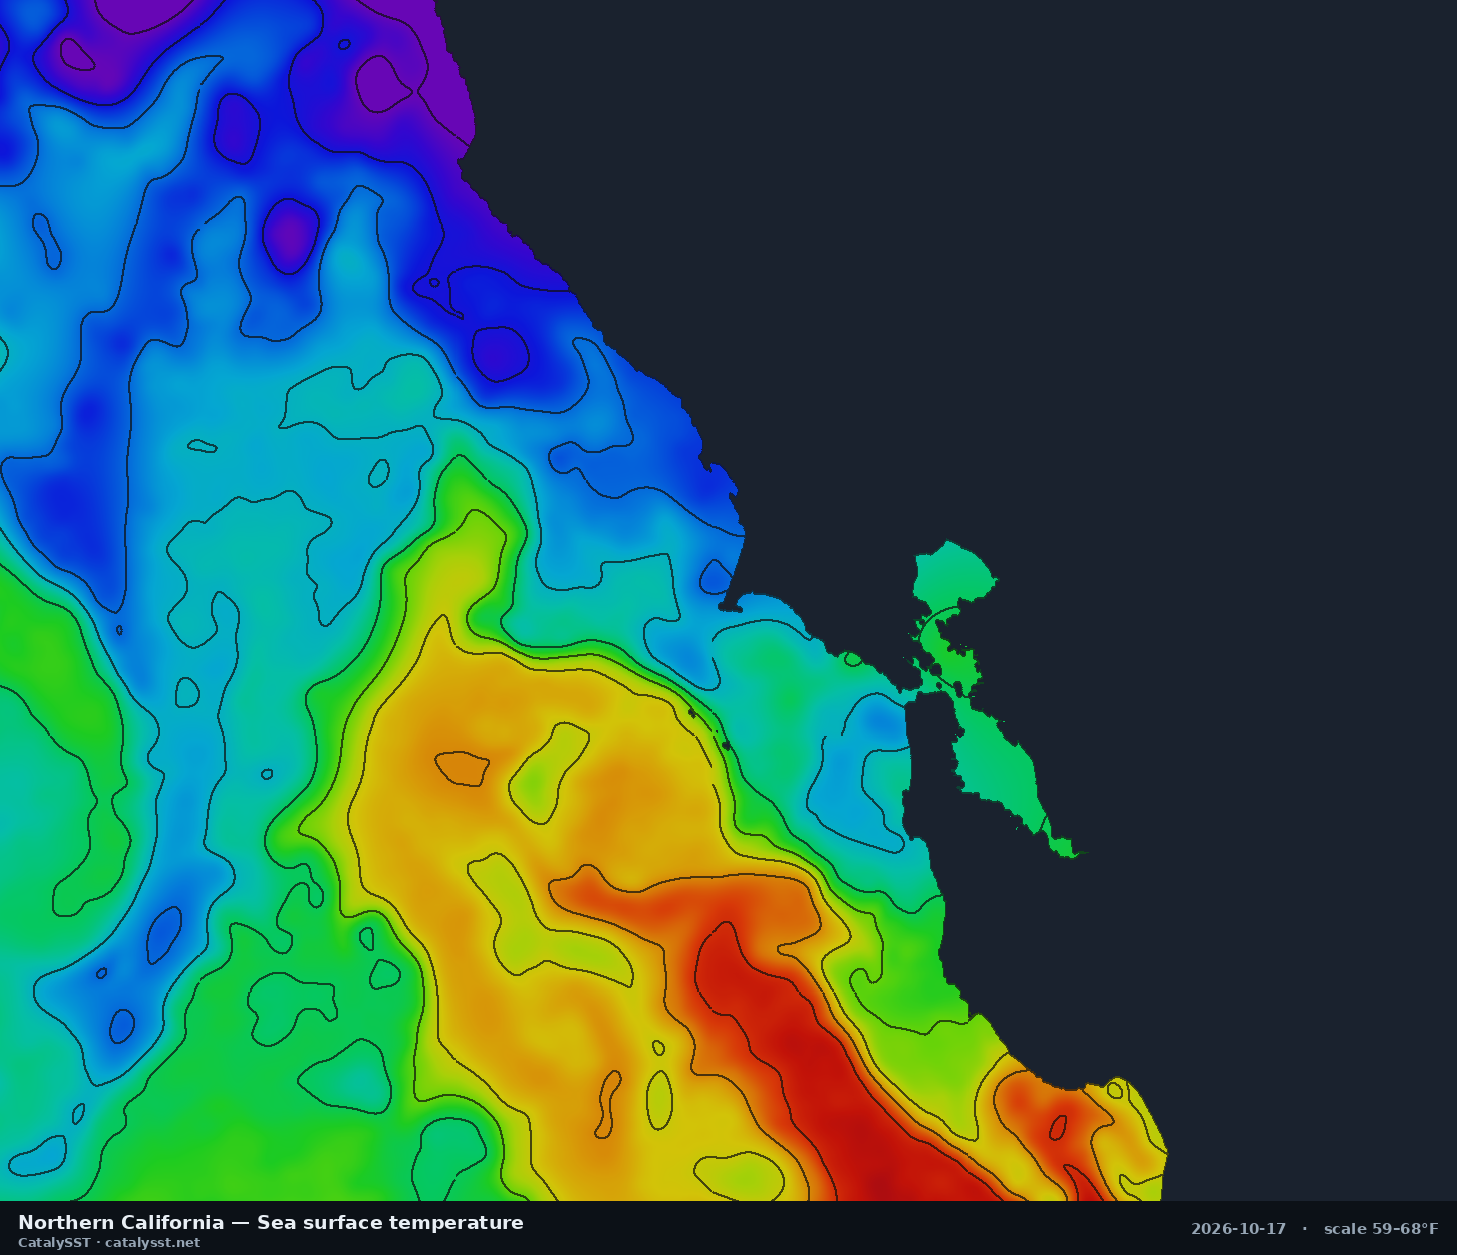
Northern California
Satellite data from October 14, 2026
San Francisco · Half Moon Bay · Bodega Bay
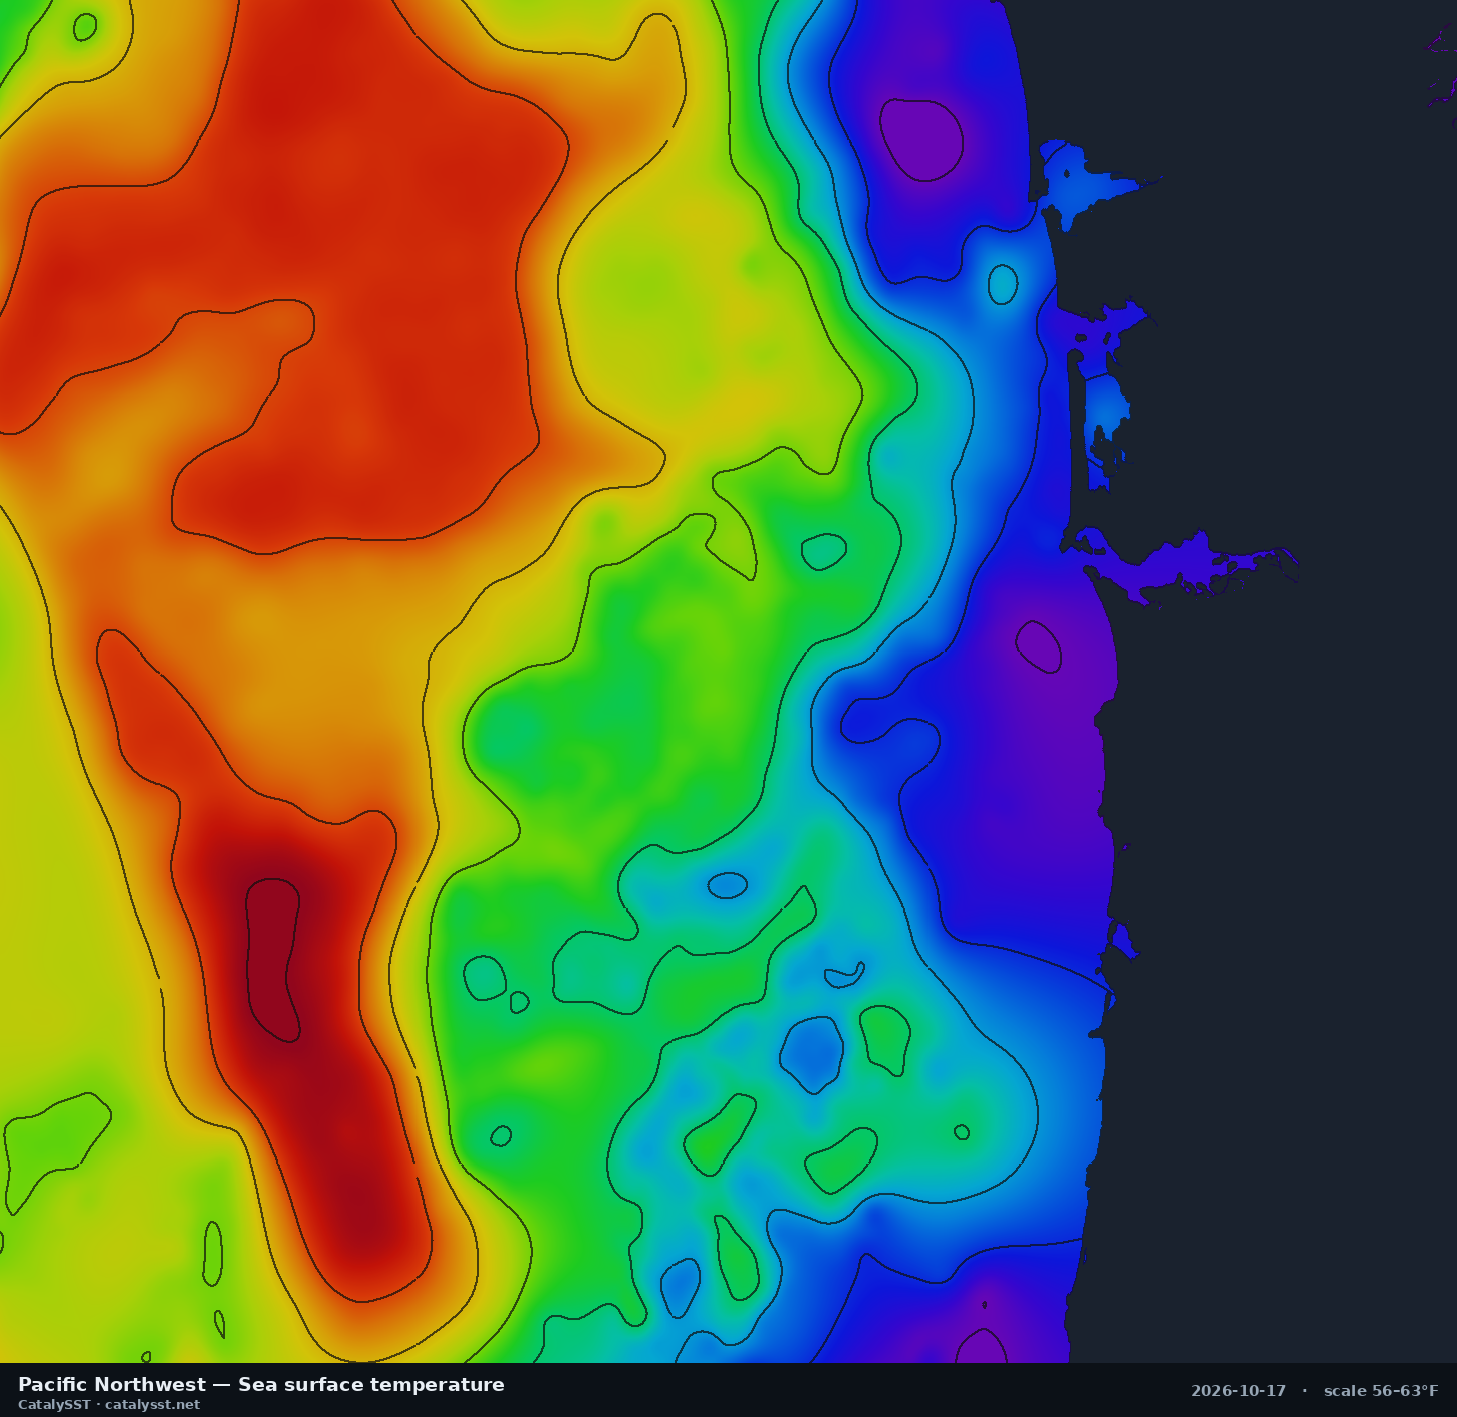
Pacific Northwest
Satellite data from October 15, 2026
Westport · the Columbia River bar · Astoria
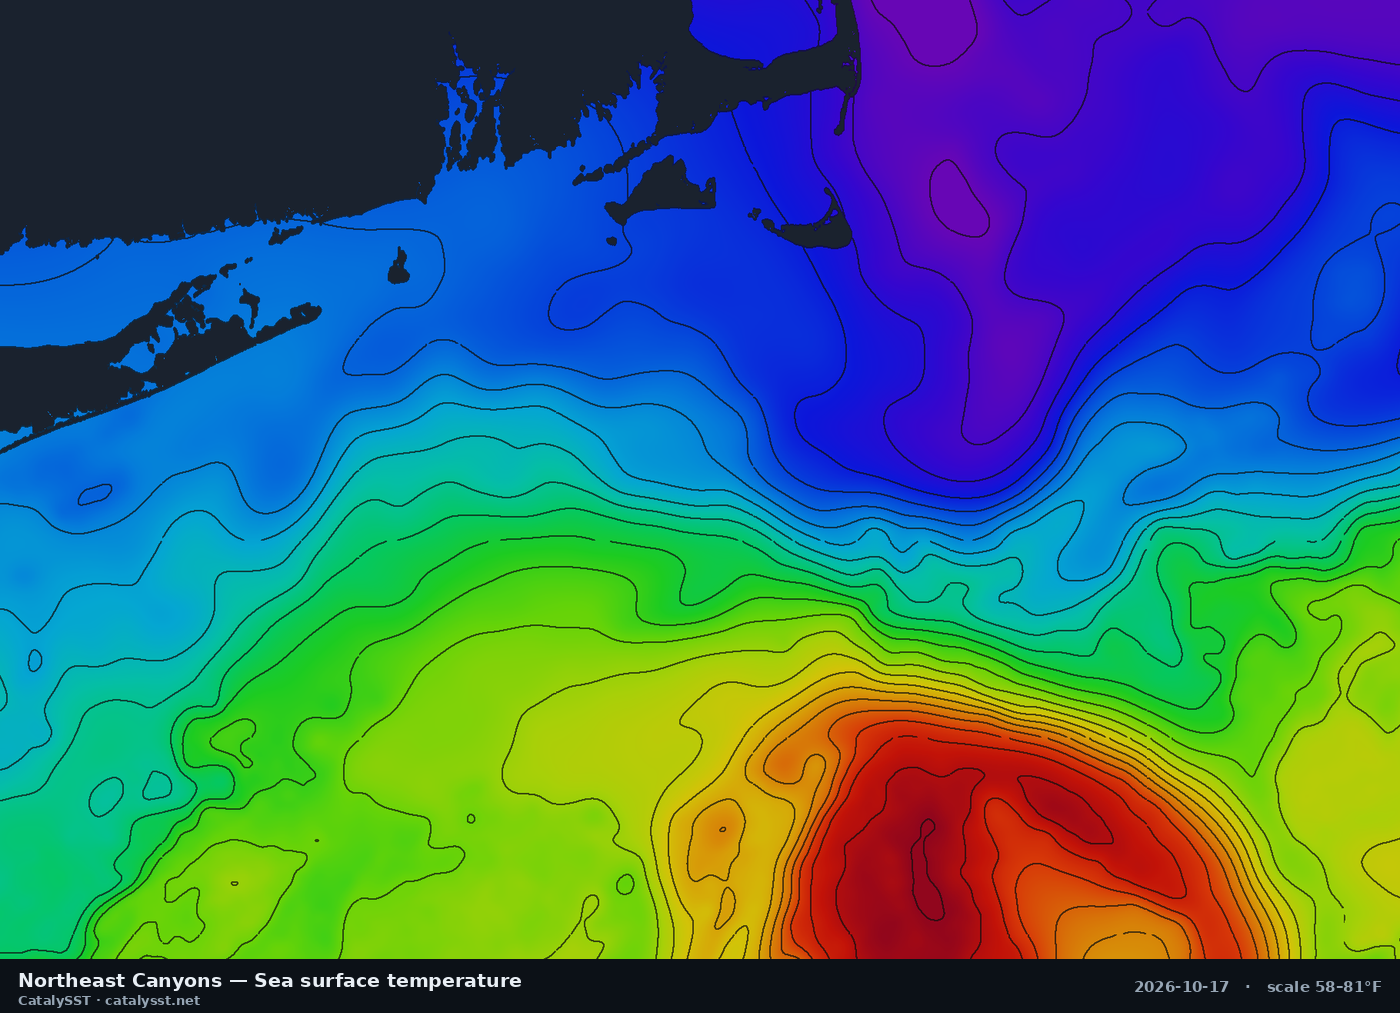
Northeast Canyons
Satellite data from October 17, 2026
Montauk · Block Island · Hudson Canyon
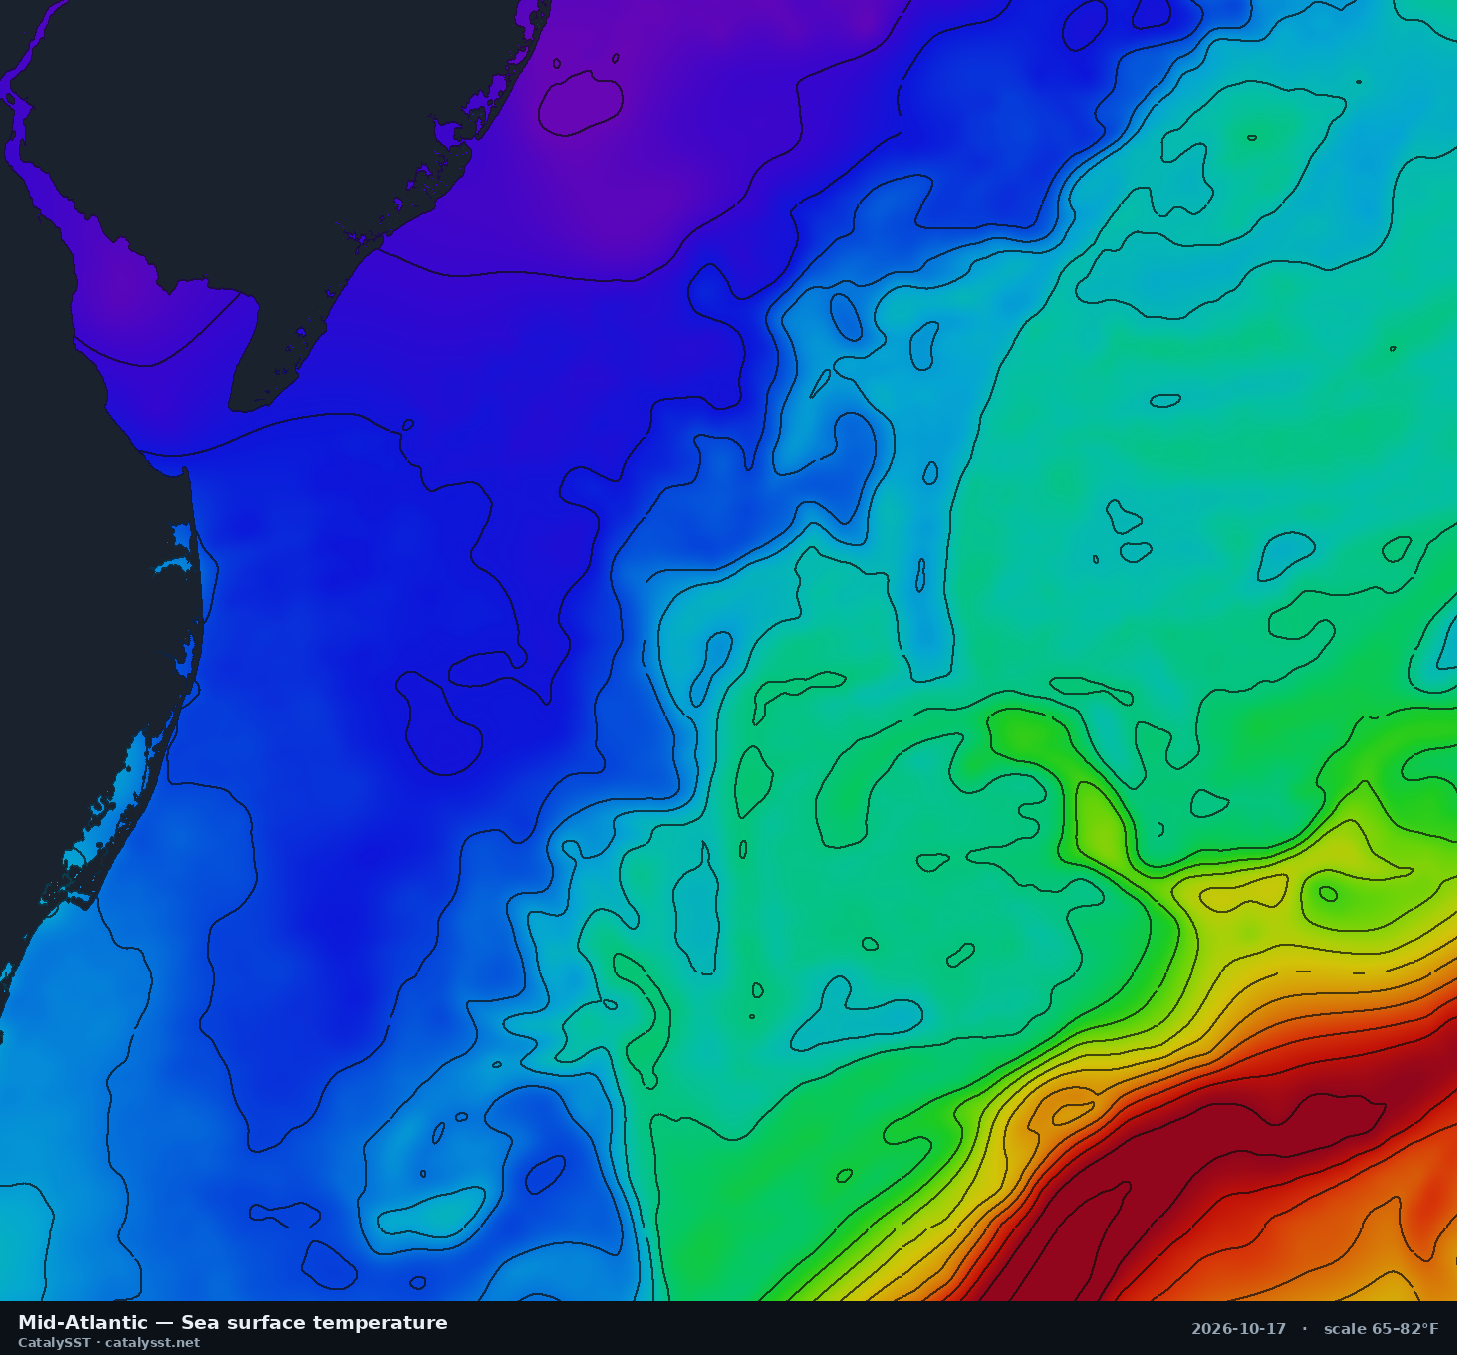
Mid-Atlantic
Satellite data from October 16, 2026
Ocean City (MD) · Cape May · Atlantic City
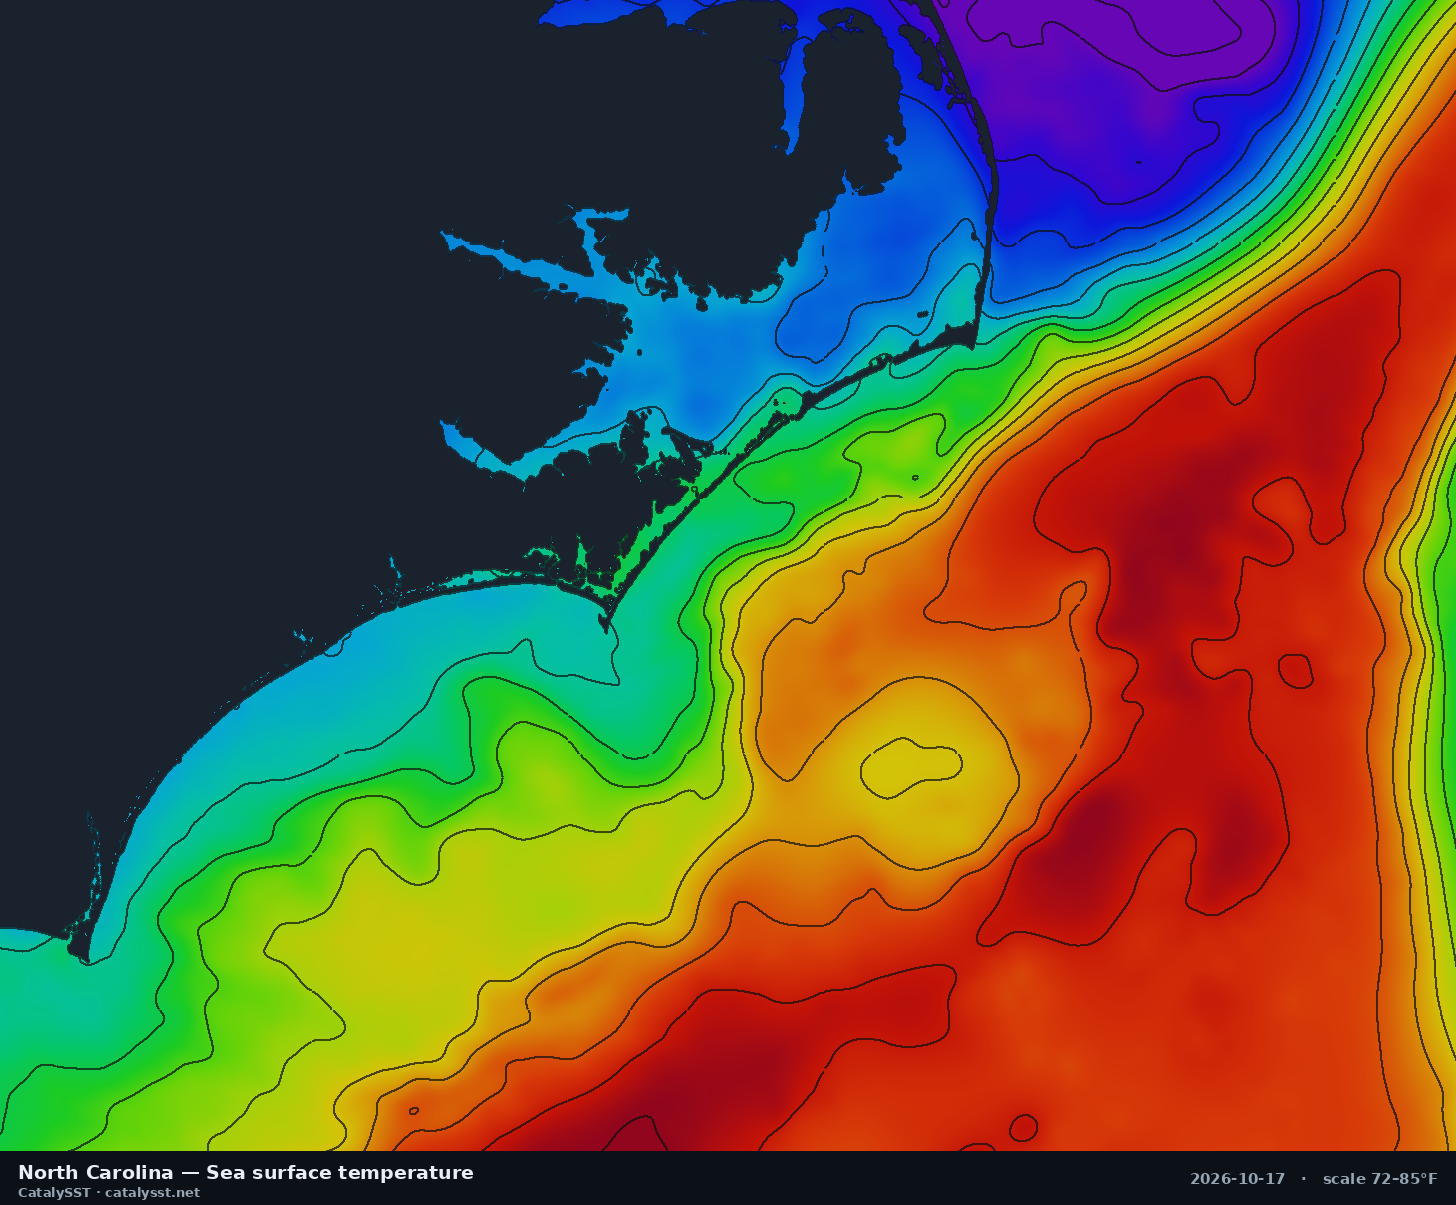
North Carolina
Satellite data from October 16, 2026
Cape Hatteras · Oregon Inlet · Morehead City
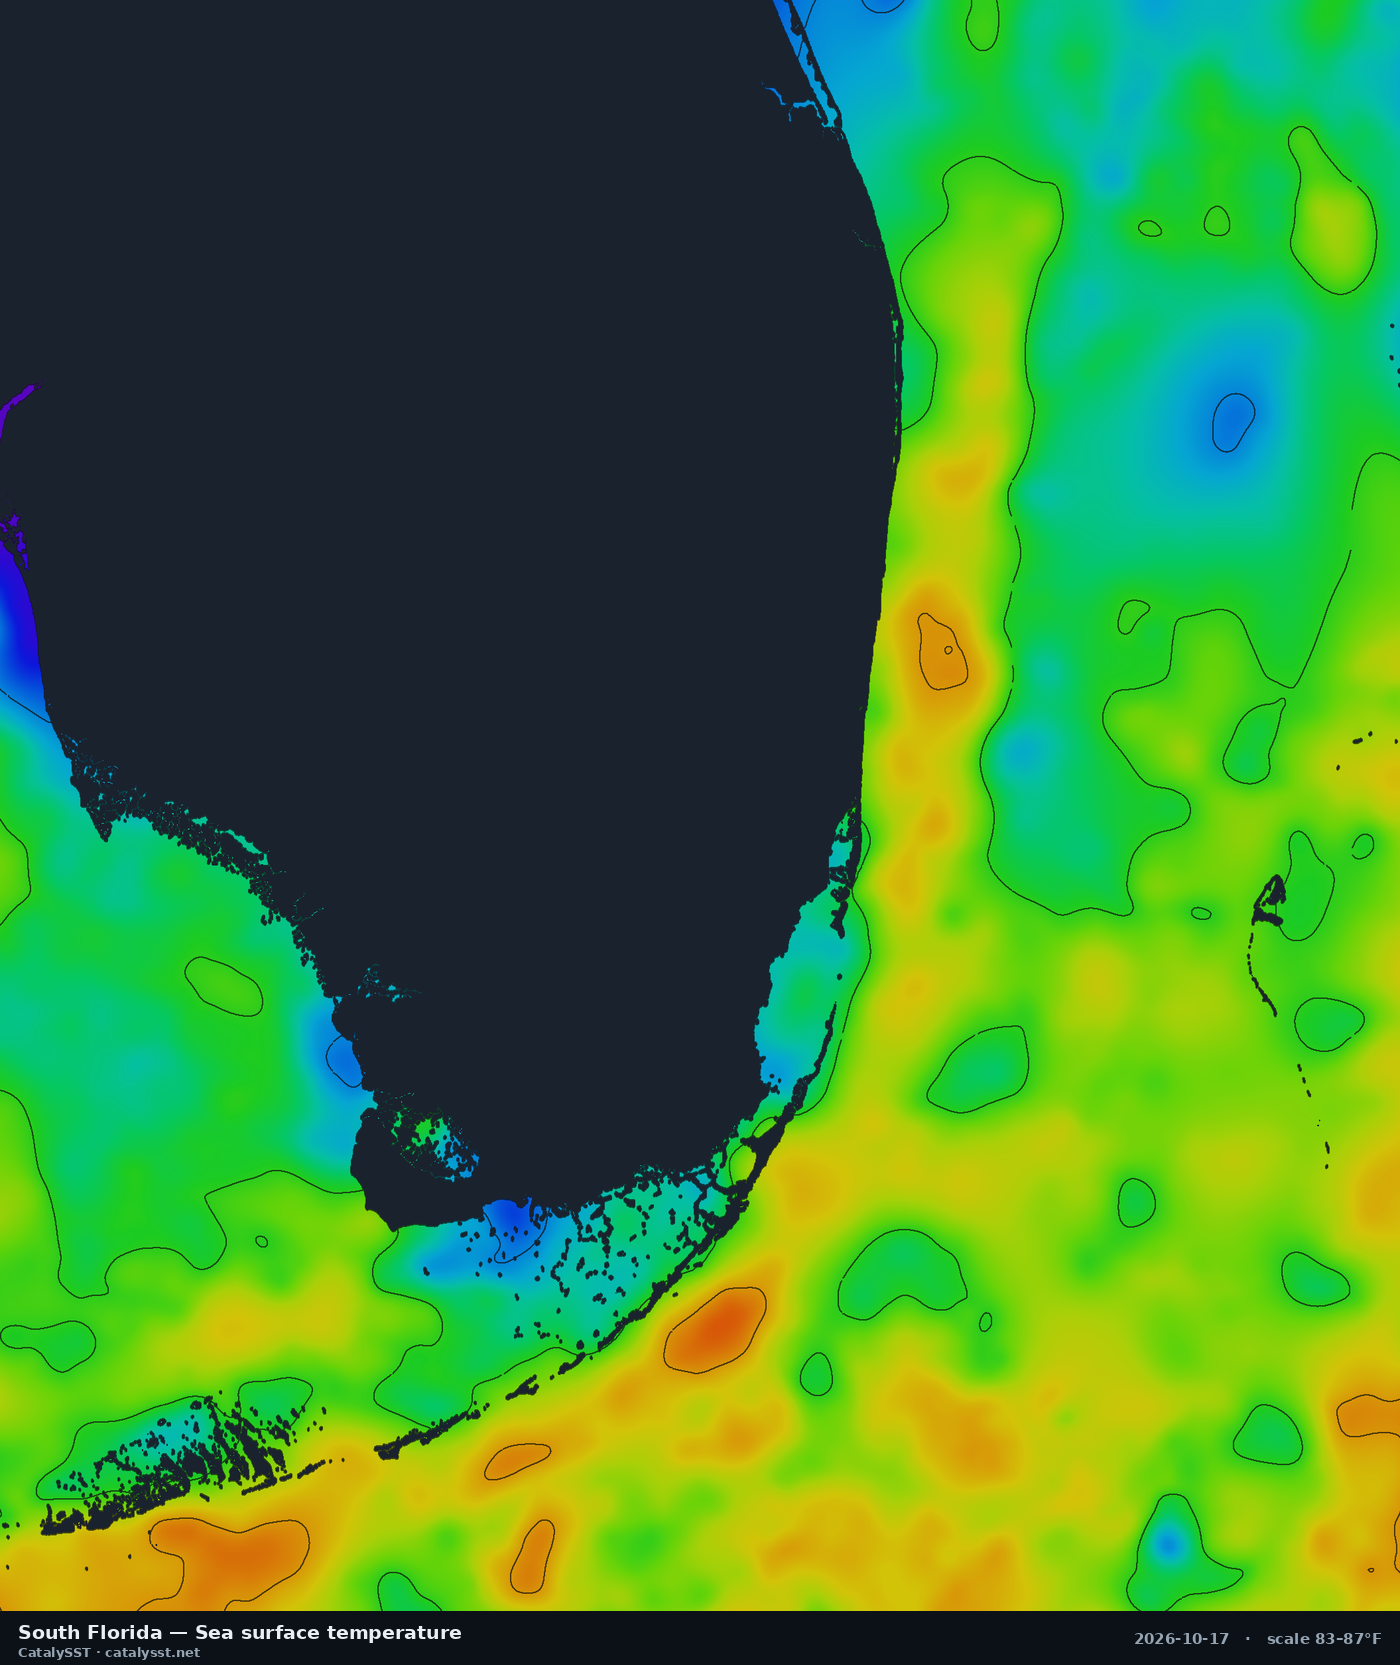
South Florida
Satellite data from October 16, 2026
Miami · Fort Lauderdale · Palm Beach
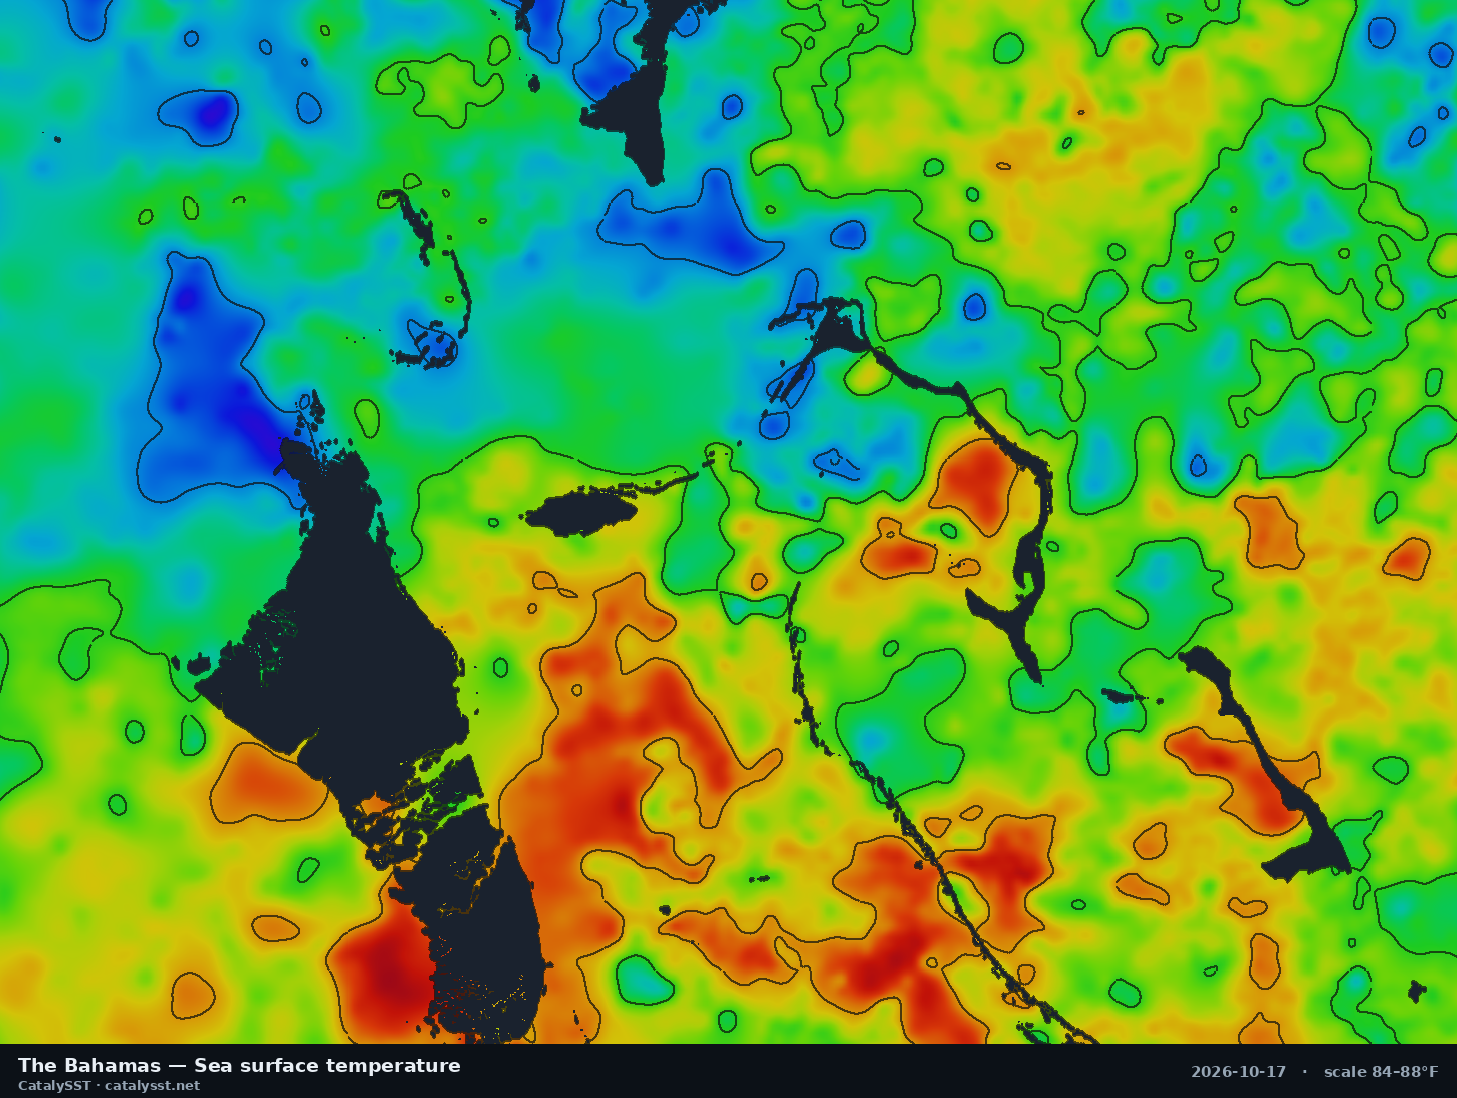
The Bahamas
Satellite data from October 16, 2026
Nassau · Andros · Eleuthera
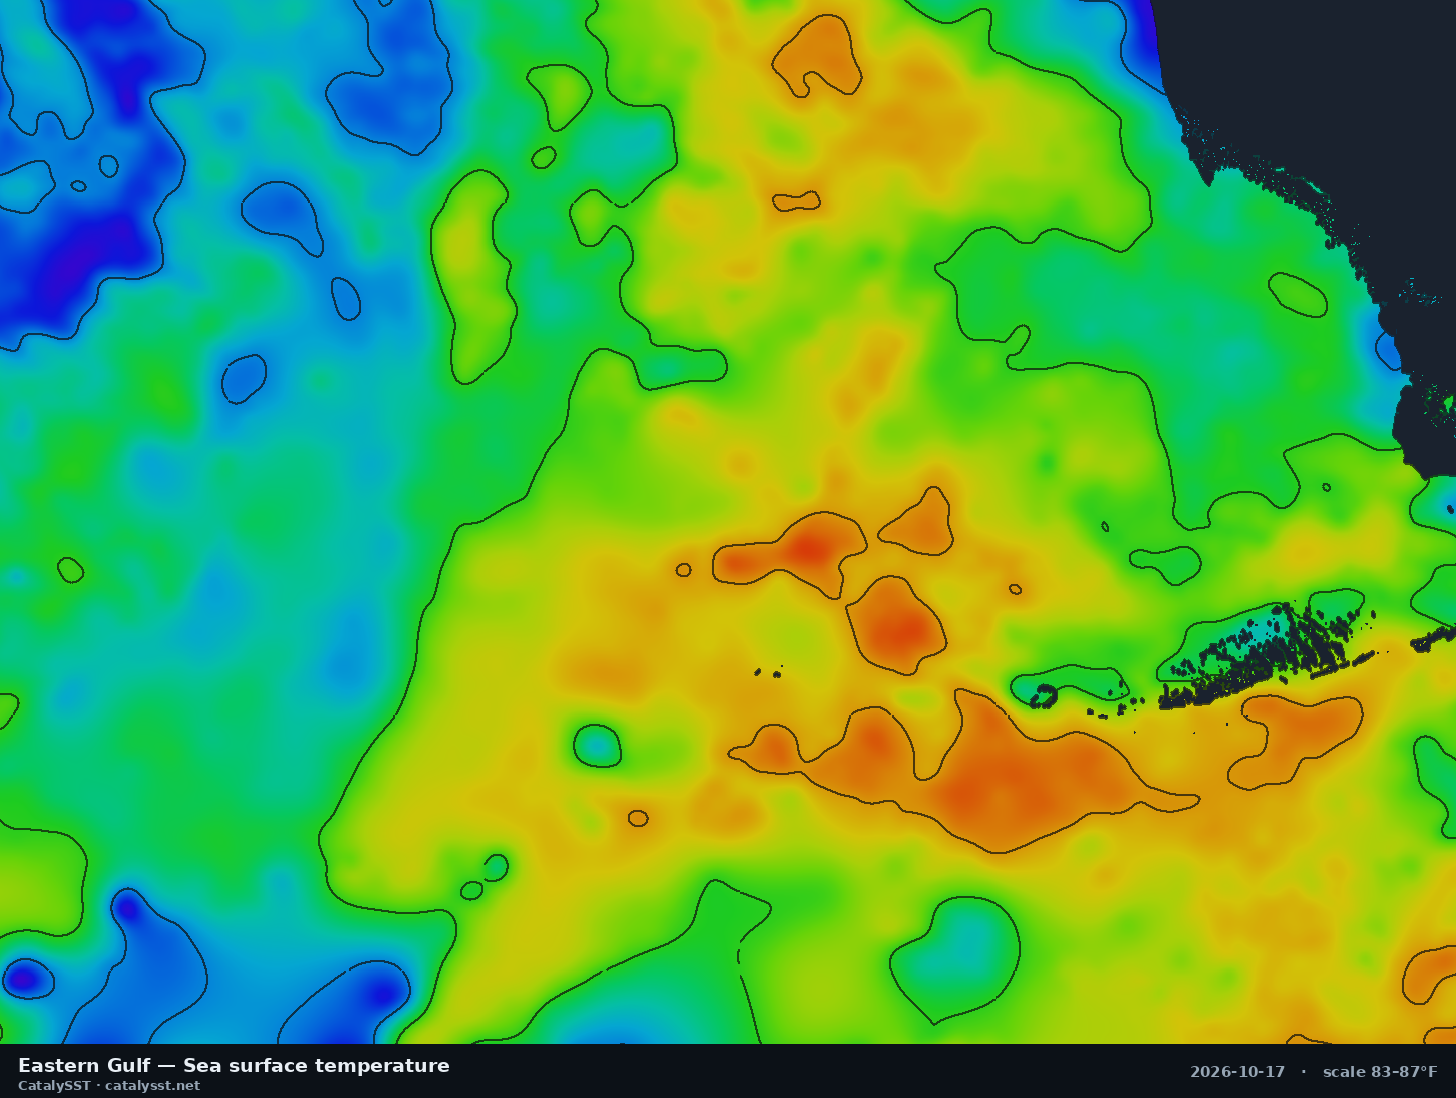
Eastern Gulf
Satellite data from October 17, 2026
Naples · Key West · the Dry Tortugas
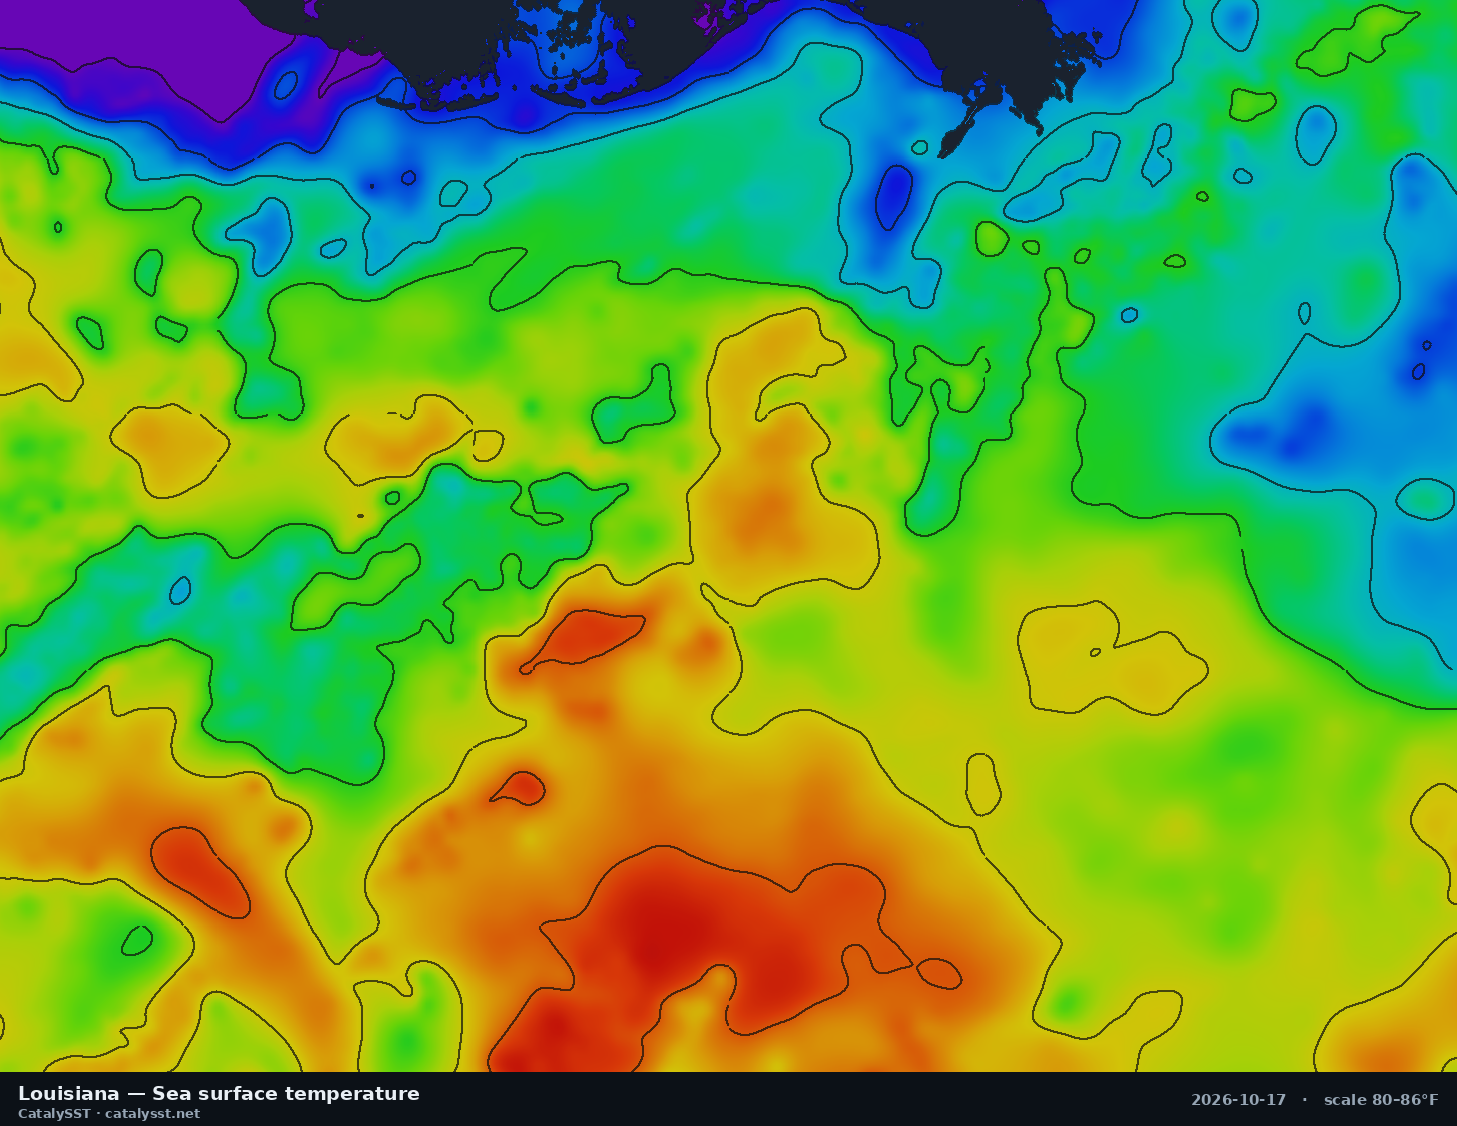
Louisiana
Satellite data from October 16, 2026
Venice · Grand Isle · Port Fourchon
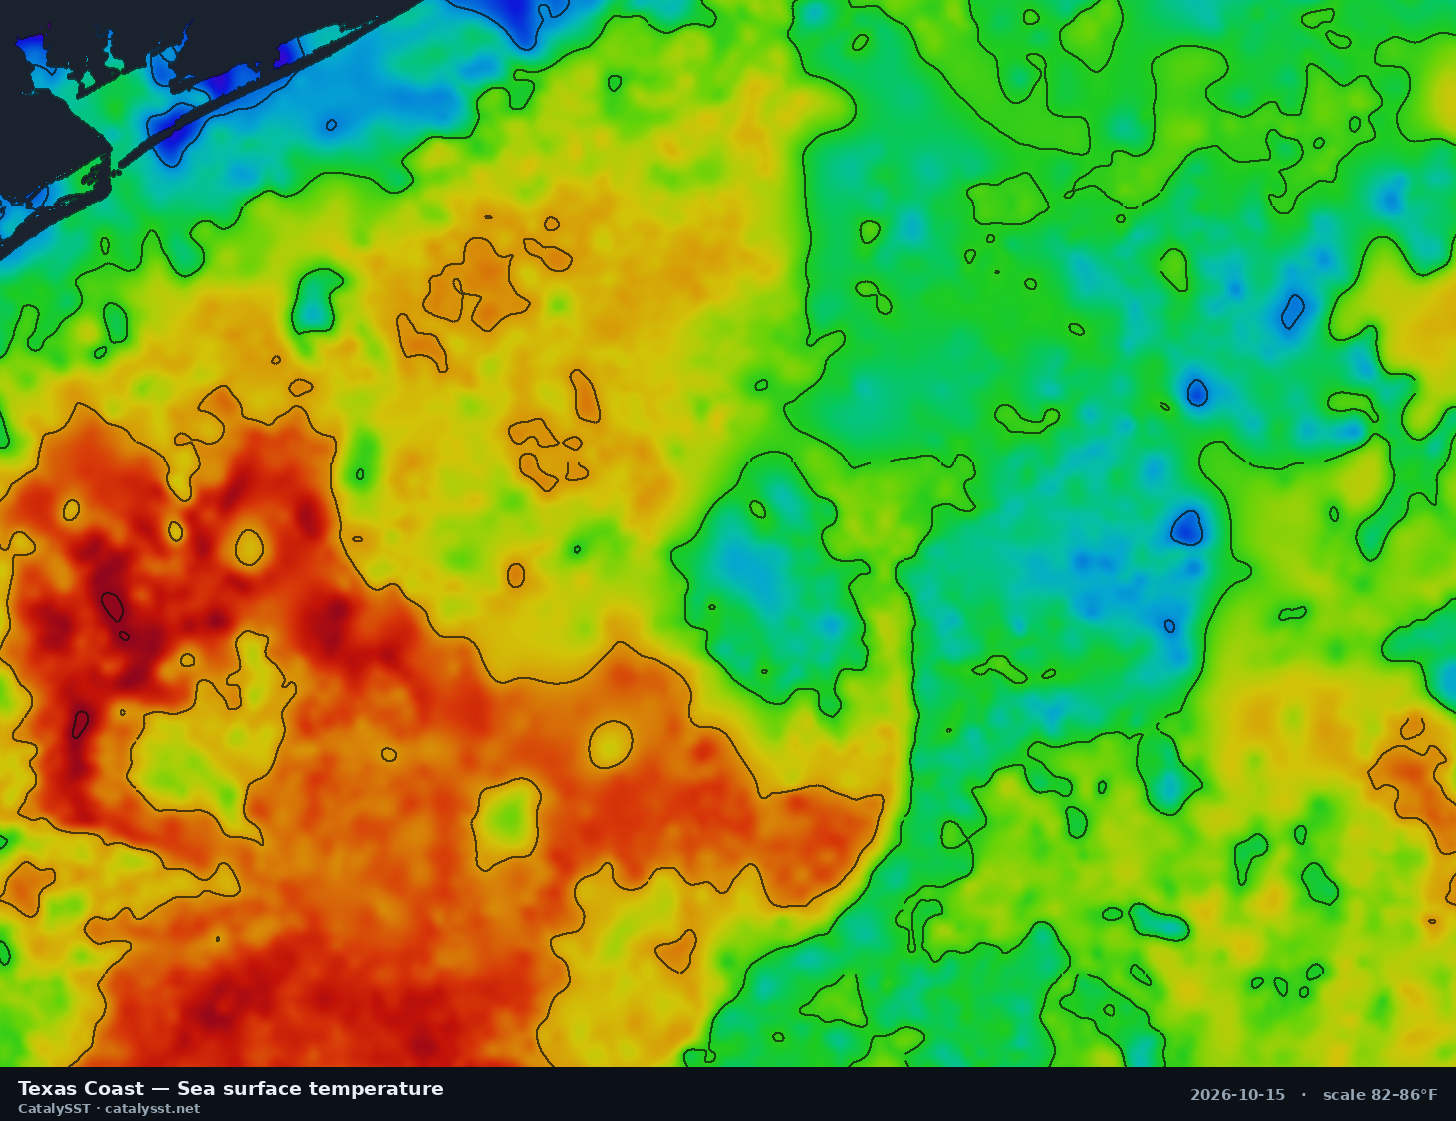
Texas Coast
Satellite data from October 15, 2026
Port O'Connor · Matagorda Bay · the Flower Garden Banks
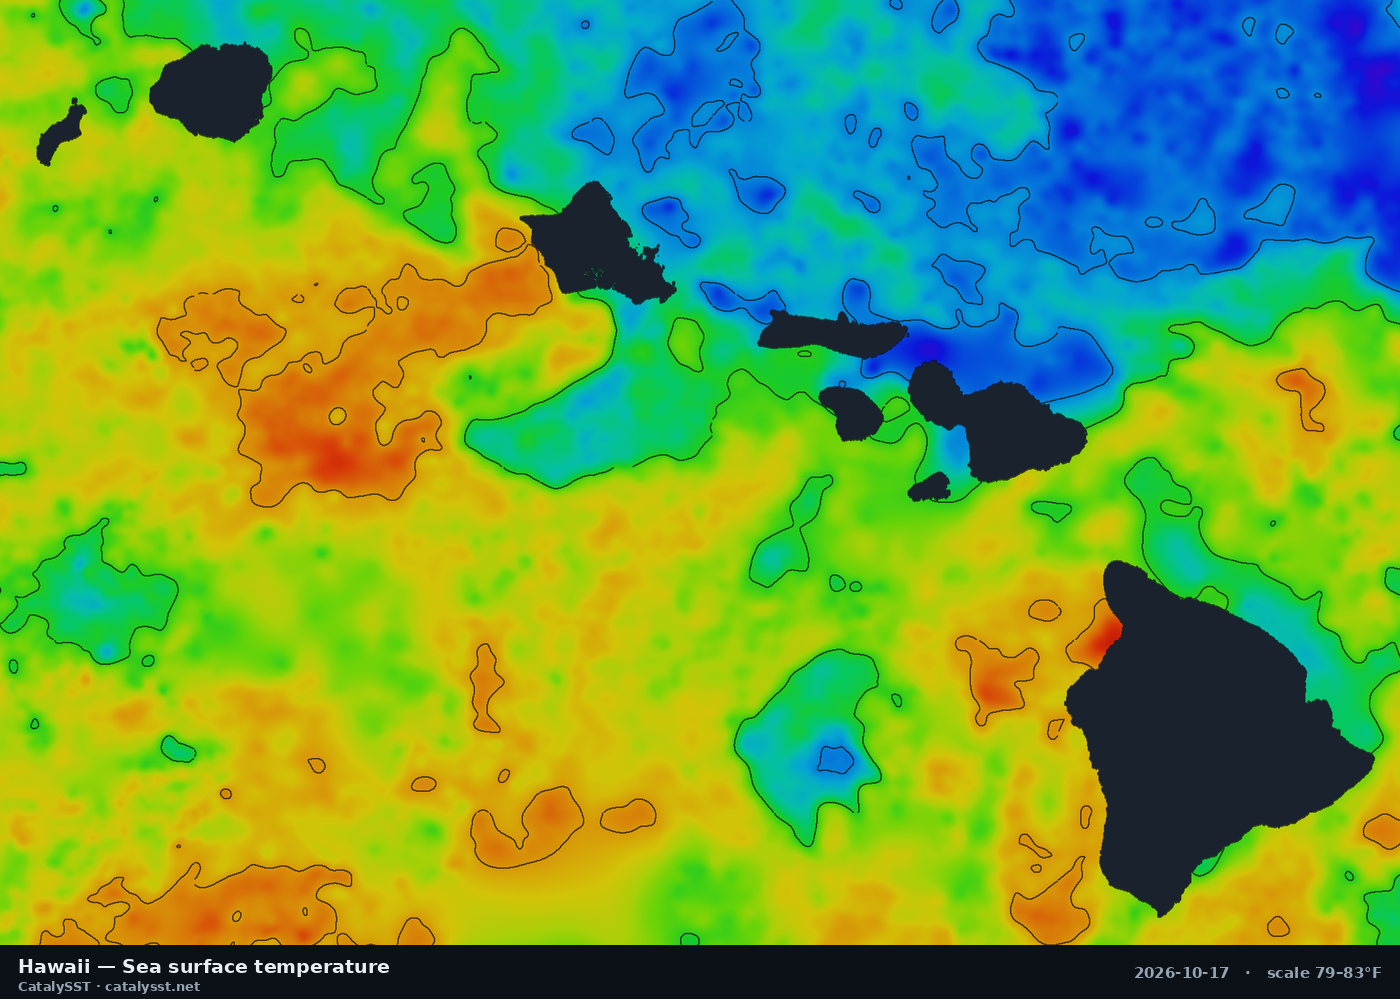
Hawaii
Satellite data from October 16, 2026
Kona · Oahu · Honolulu
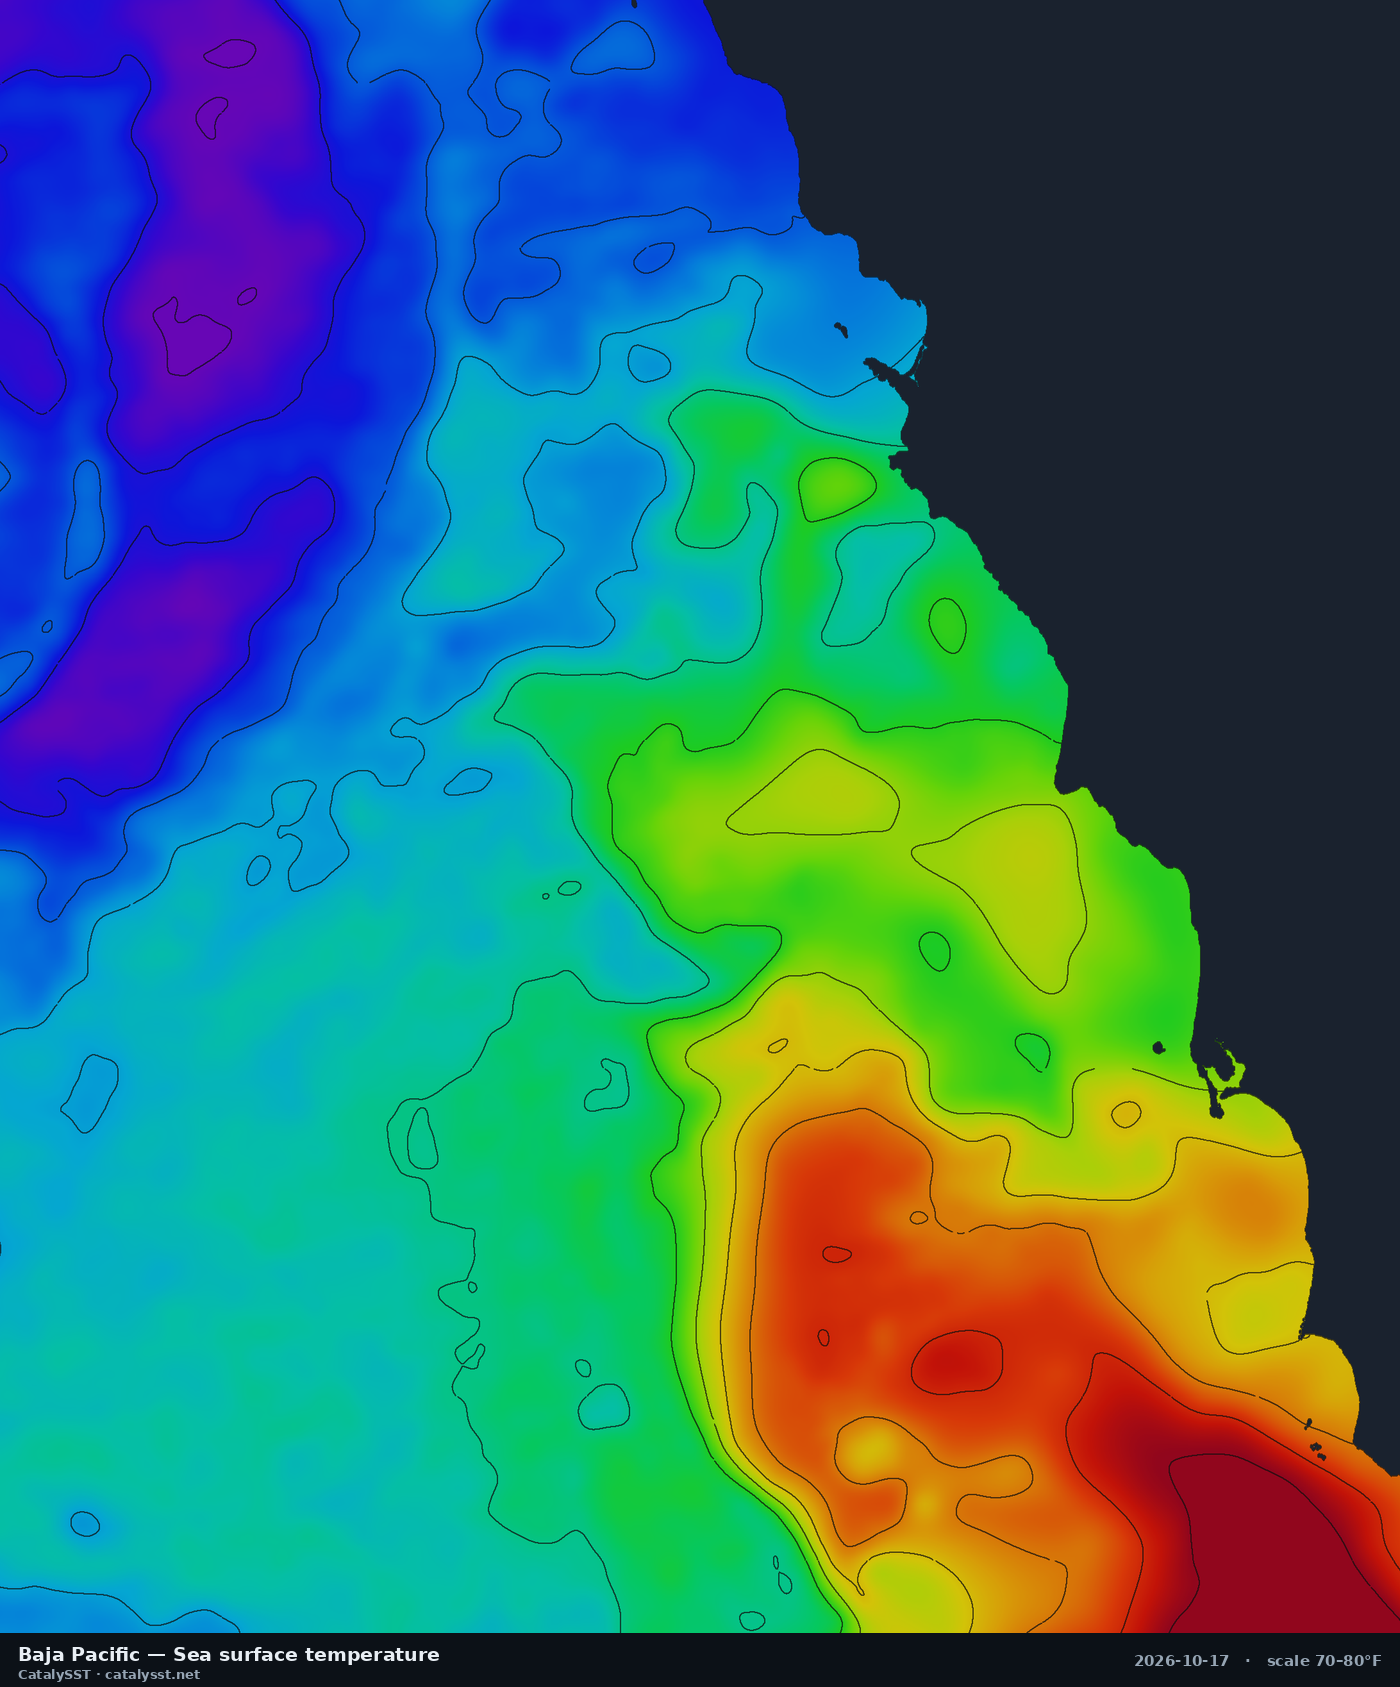
Baja Pacific
Satellite data from October 16, 2026
Ensenada · Todos Santos Island · San Quintín
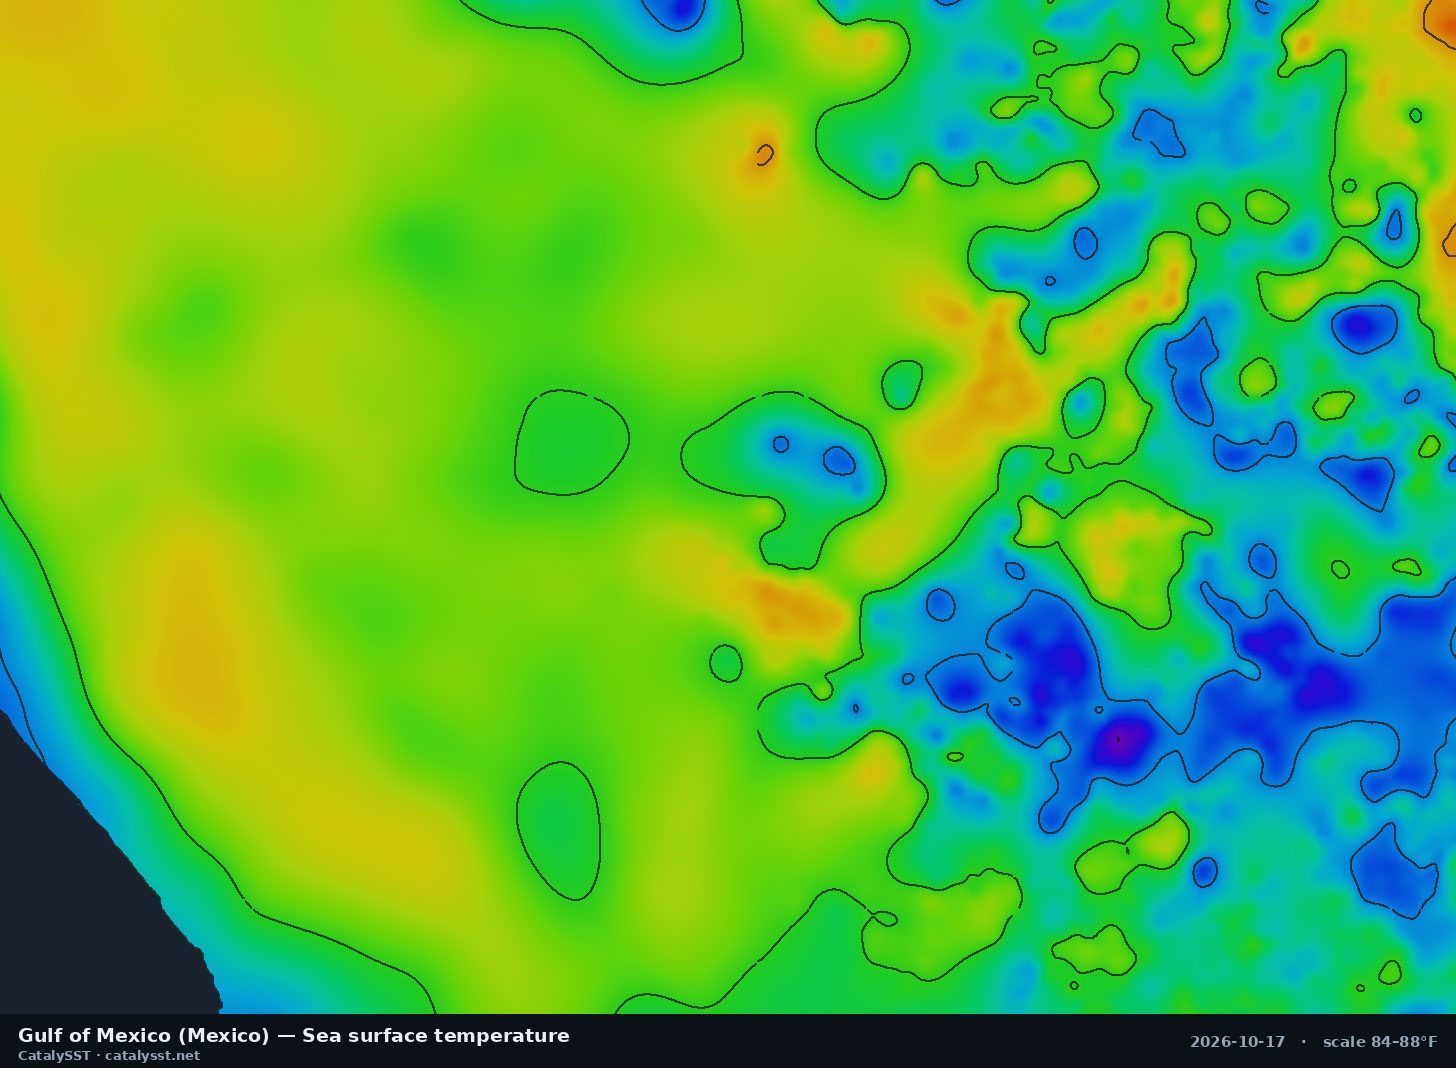
Gulf of Mexico (Mexico)
Satellite data from October 16, 2026
Nautla · Vega de Alatorre
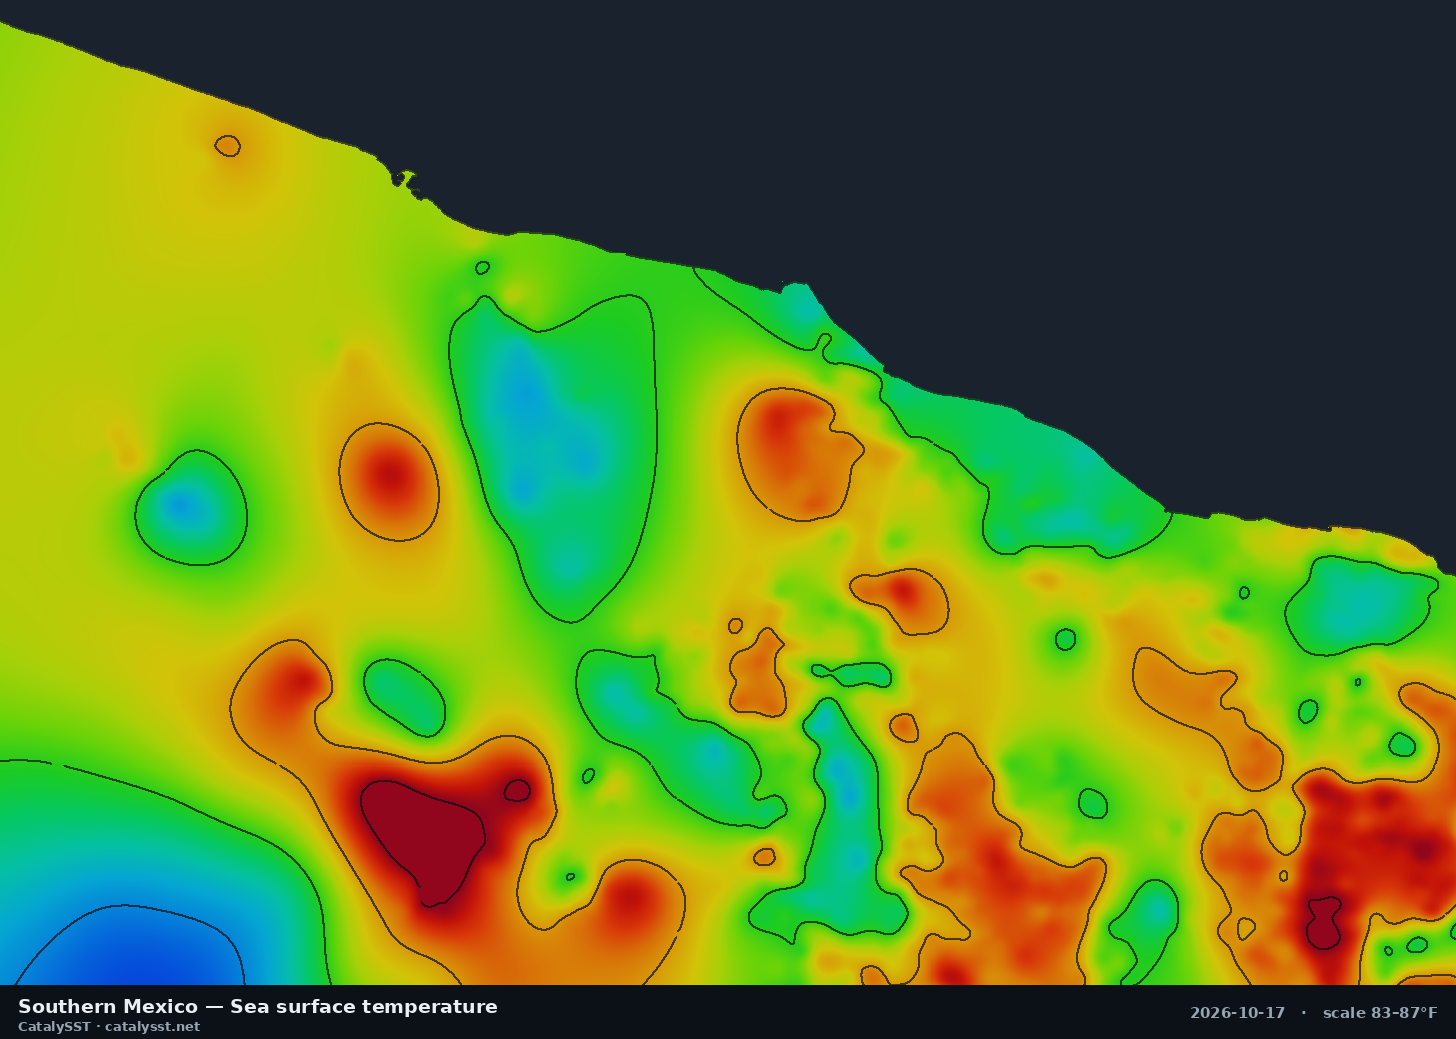
Southern Mexico
Satellite data from October 16, 2026
Acapulco · Puerto Escondido · Pie de la Cuesta
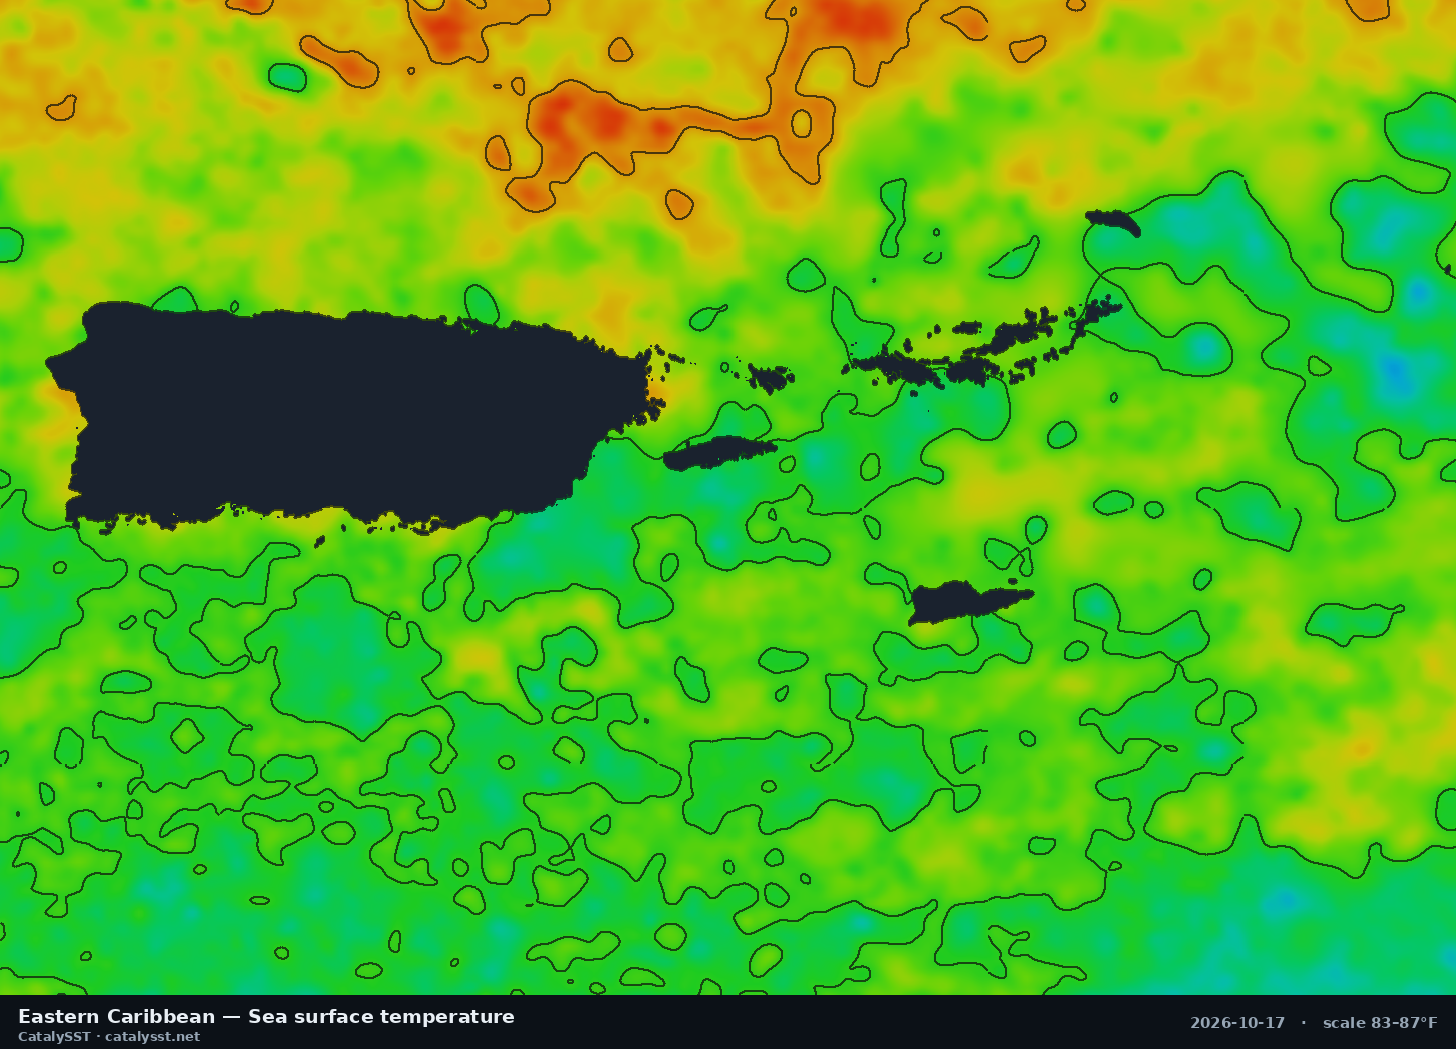
Eastern Caribbean
Satellite data from October 16, 2026
San Juan · Fajardo · St. Thomas
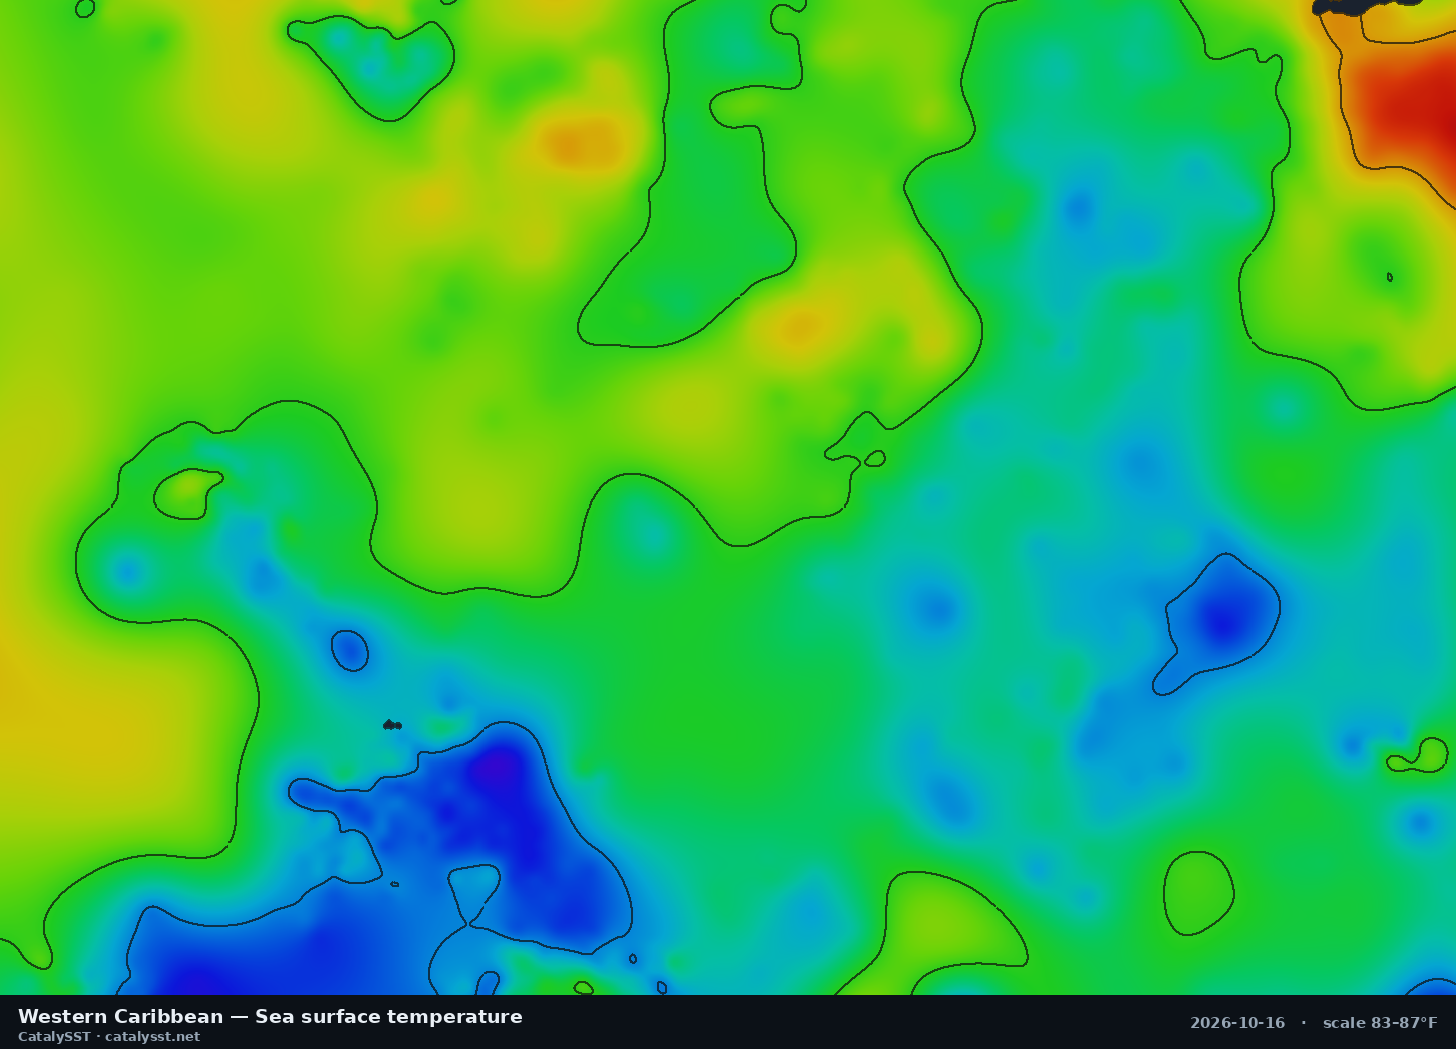
Western Caribbean
Satellite data from October 16, 2026
the Swan Islands · Grand Cayman
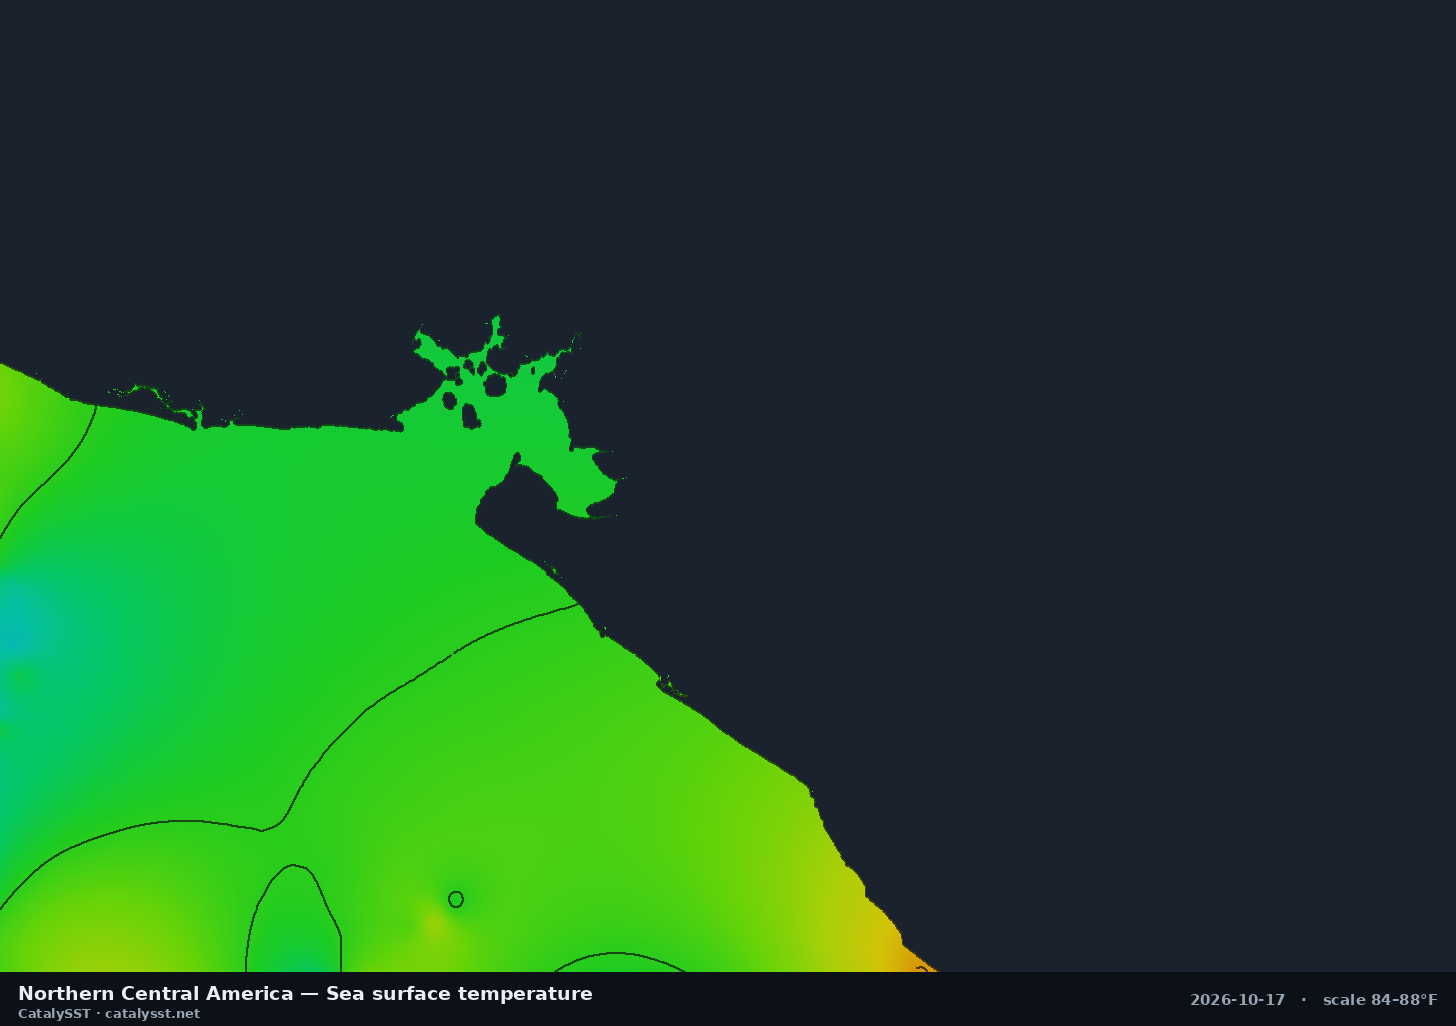
Northern Central America
Satellite data from October 16, 2026
the Gulf of Fonseca · Corinto · Puerto Sandino
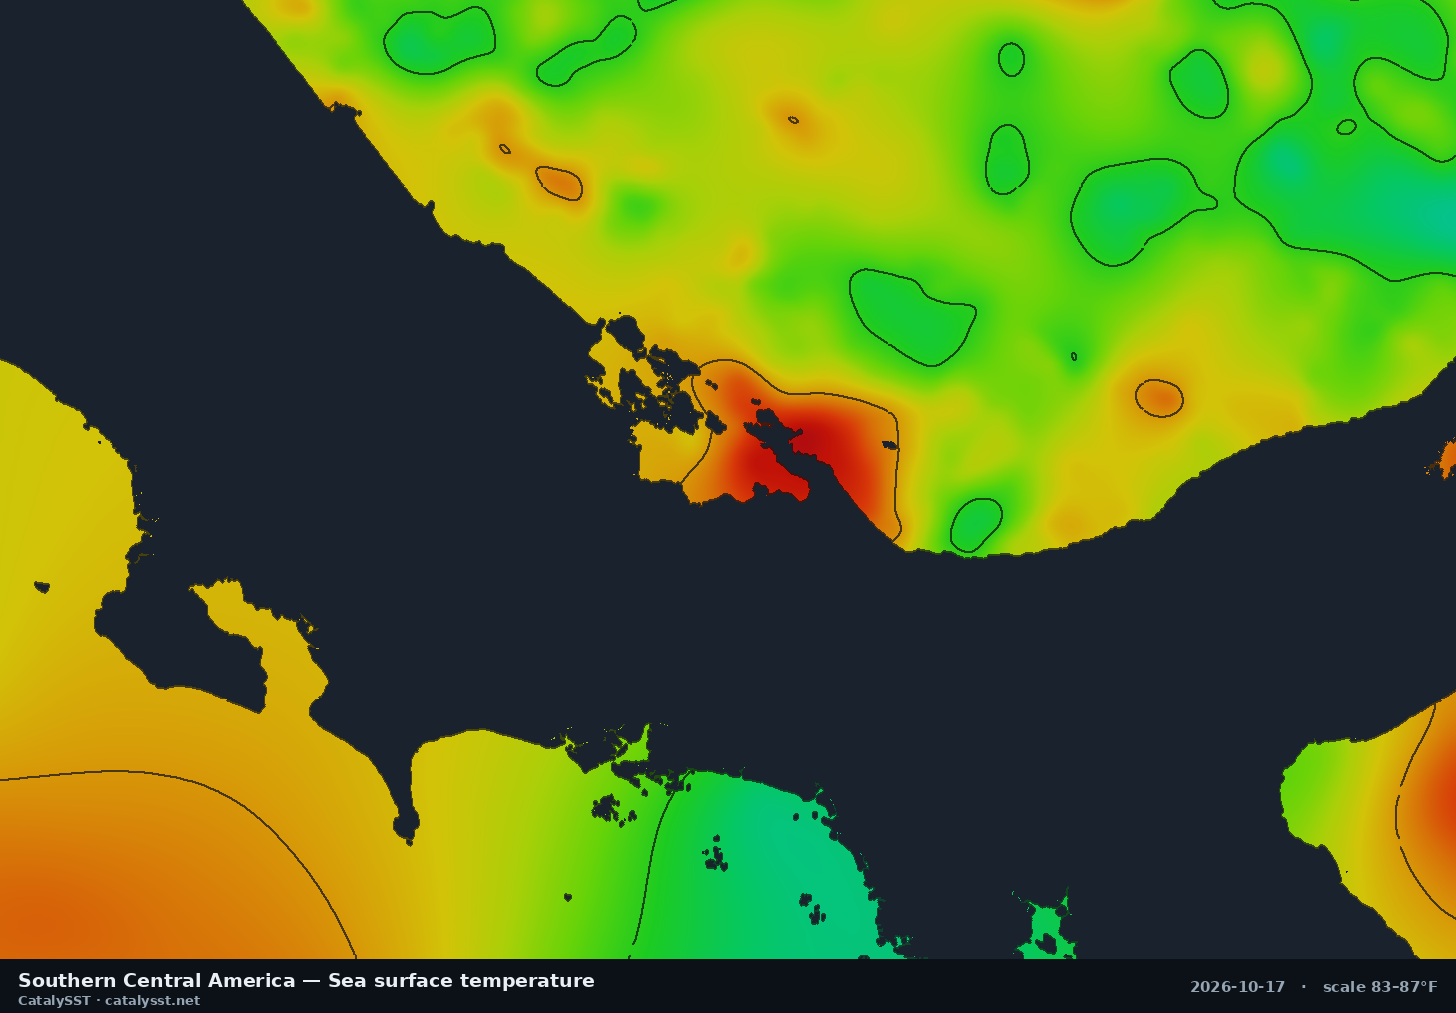
Southern Central America
Satellite data from October 16, 2026
Golfito · Drake Bay · the Osa Peninsula


How to use these charts
Pick the box that holds your port and the water you can reach in a day. Each card names a few of the ports and landmarks inside it, and every regional page lists the rest along with the chart’s exact extent. Neighbouring boxes can overlap, so if your grounds are near an edge, check both.
Sea surface temperature shows where the water is warm or cool, and the contour lines mark the breaks where two bodies of water meet. Chlorophyll shows the colour of the water: green is productive, blue is clean, and bait gathers on the edge between them. The best-looking water is usually where a temperature break and a chlorophyll edge line up, so read the chlorophyll charts alongside these.
Every image regenerates twice a day from the latest satellite data in the Catalysst app. The date under each card is the date of the satellite data, not the time the picture was drawn. Under heavy cloud the picture still fills in, but the detail comes from coarser or older data, so a break seen on a cloudy day deserves a second look on the next clear one. Where we have them, the regional pages add the day’s numbers: the temperature range, the change on the week and nearby buoy readings.
Every region, live and zoomable
1-, 3- and 7-day windows, contour lines, and live AIS on the same map. 7-day free trial.
Start free trial