Sea surface temperature
Sea surface temperature (SST) fishing maps
Sea surface temperature is the single most useful chart in offshore fishing. Pelagics — bluefin, yellowfin, yellowtail, dorado, marlin — hold to specific temperature bands, and they hunt the seams where two water masses meet. Catalysst maps daily satellite SST so you can find those temperature breaks before you leave the dock.
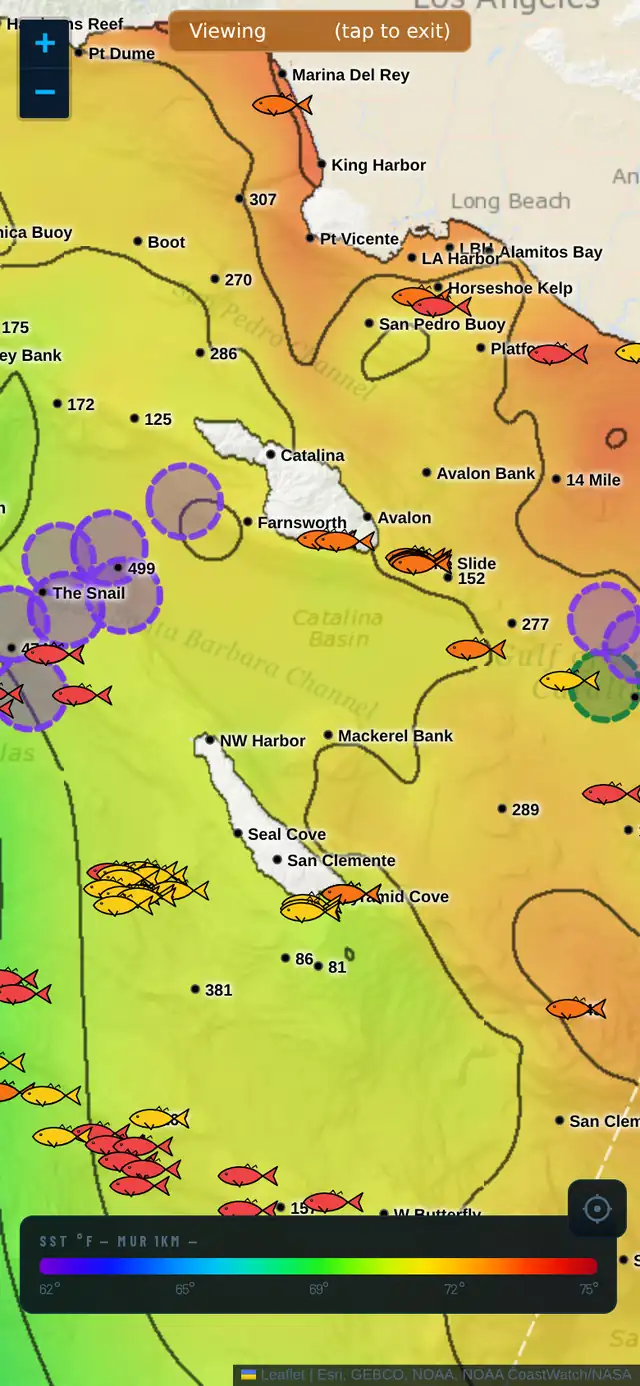
What is sea surface temperature, and why does it matter for fishing?
Sea surface temperature (SST) is the satellite's read of the top millimeter of the ocean. It's the cleanest signal you have for where fish are likely to be: predators track narrow temperature ranges, and bait stacks where conditions change.
The money is in the break — a sharp, narrow line where warm and cool water collide. Bait piles on the warm-water side; predators hunt the seam. Find the break inside your target species' temperature band, and you've found the most productive water in the area.
How to read a temperature break
Look for a color transition that's tight, not gradual. A break that goes from 64°F to 70°F in half a mile is far more productive than one that fades over ten miles. The sharper the gradient, the stronger the edge.
Catalysst draws isotherm contour lines over the SST so you can see exactly where the 68° line runs and how it bends around offshore structure like banks, canyons, and seamounts. Fish relate to where the temperature line meets the structure.
Target temperatures by species (SoCal rough guide)
Bluefin tuna 62–72°F. Yellowfin tuna 70–82°F. Yellowtail 62–68°F. Dorado (mahi) 75°F and up. Marlin 75–82°F. These shift with season and region — use the chart's local color scale and look for breaks inside your target's band, not outside it.
How Catalysst maps SST
Catalysst renders MUR 1km satellite SST at high resolution, clipped tight to the coastline, with isotherm contour lines and a dynamic color scale that adapts to the local temperature range so subtle breaks stay visible.
You get three time windows. The 1-day chart is sharpest but has cloud gaps — use it to find live, current breaks. The 3-day fills clouds with a light smooth. The 7-day shows how breaks moved across the week, so you can spot persistent structure that's likely to still be there tomorrow. Stack all three and watch a break hold or drift over time.
Frequently asked
What temperature do tuna like?
It depends on species: bluefin hold roughly 62–72°F, yellowfin 70–82°F. But the temperature alone matters less than the break — the sharp edge where warm and cool water meet inside that band is where the fish concentrate.
Why does Catalysst show contour lines on the SST chart?
Contour lines (isotherms) trace each temperature exactly, so you can see precisely where, say, the 68° line runs and how it bends around structure. Color alone makes breaks hard to pinpoint; the lines make them precise.
Which SST chart should I use — 1-day, 3-day, or 7-day?
1-day for the sharpest, most current breaks (but expect cloud gaps). 3-day to fill clouds. 7-day to confirm a break has been holding all week rather than being a one-day artifact. The pros stack all three.
See it in the app
7-day free trial. Plan your next trip from the dock.